Safety record
Key Performance Indicators
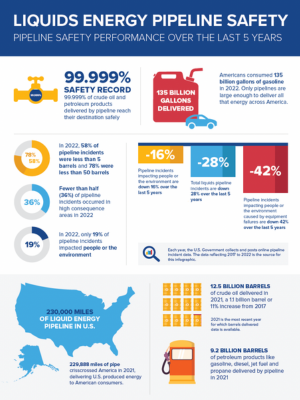
Pipelines are the safest way to transport liquid energy with 99.999% of barrels delivered by pipeline arriving at their destinations safely. However, no form of transportation is perfect and pipeline incidents can and do happen.
Tracking how, where and why pipeline incidents occur helps pipeline operators and government regulators see how safely pipelines are operating and the reasons behind pipeline incidents when they occur. Pipeline operators use this data to design safety improvement programs. Particularly useful measures of pipeline safety examine incident size, location, commodity and cause.
The liquids pipeline industry also tracks a core set of Key Performance Indicators (KPIs) as a sign of overall pipeline safety performance. These KPIs are based primarily on incidents impacting the people or the environment (IPE). They were created through a collaborative effort between PHMSA, public safety advocates represented by the Pipeline Safety Trust and the liquids pipeline industry. They reflect the highest priority we place on protecting people and the environment.
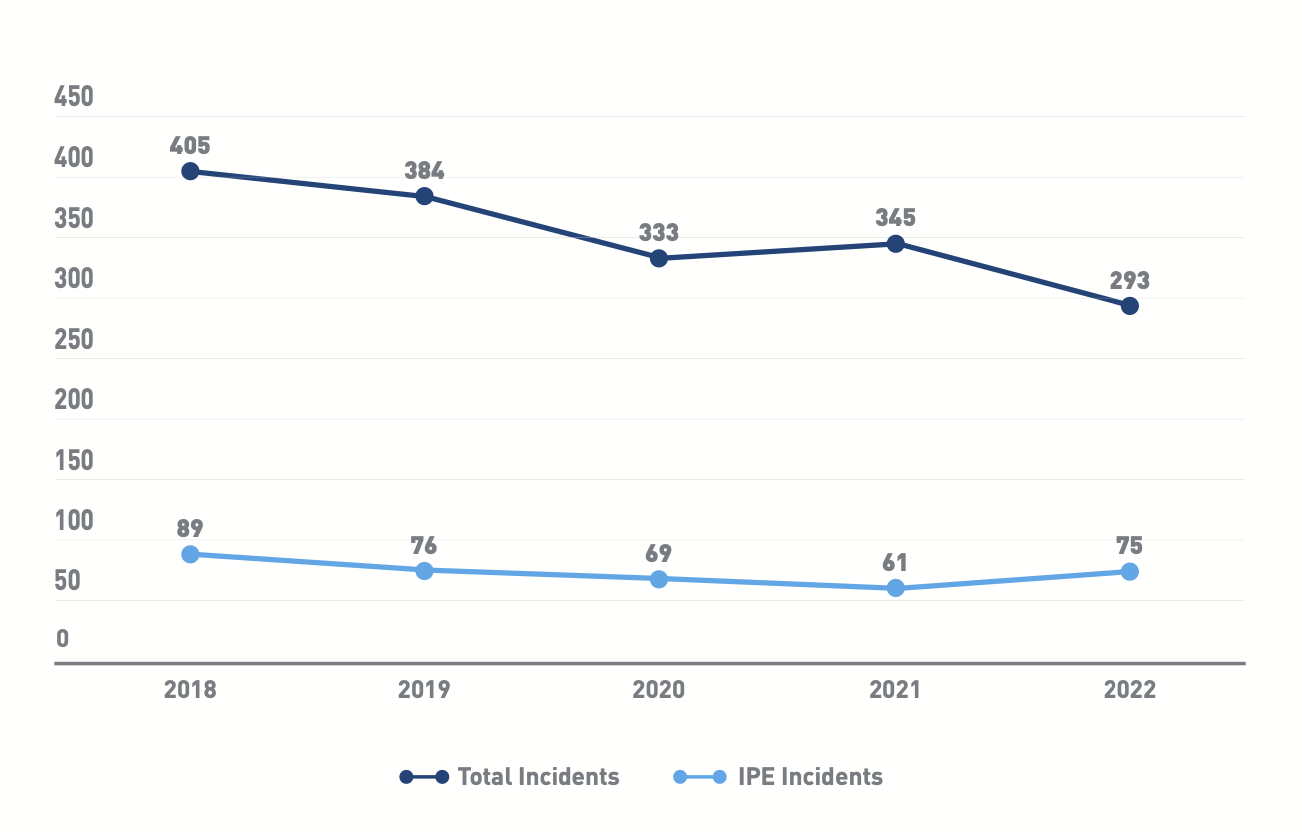
Incidents Impacting People or the Environment
Pipeline incidents impacting people or the environment decreased 16 percent from 2018 to 2022. Total pipeline incidents were down, as well, dropping 28 percent over the last five years, with 112 fewer incidents in 2022 compared to 2018.
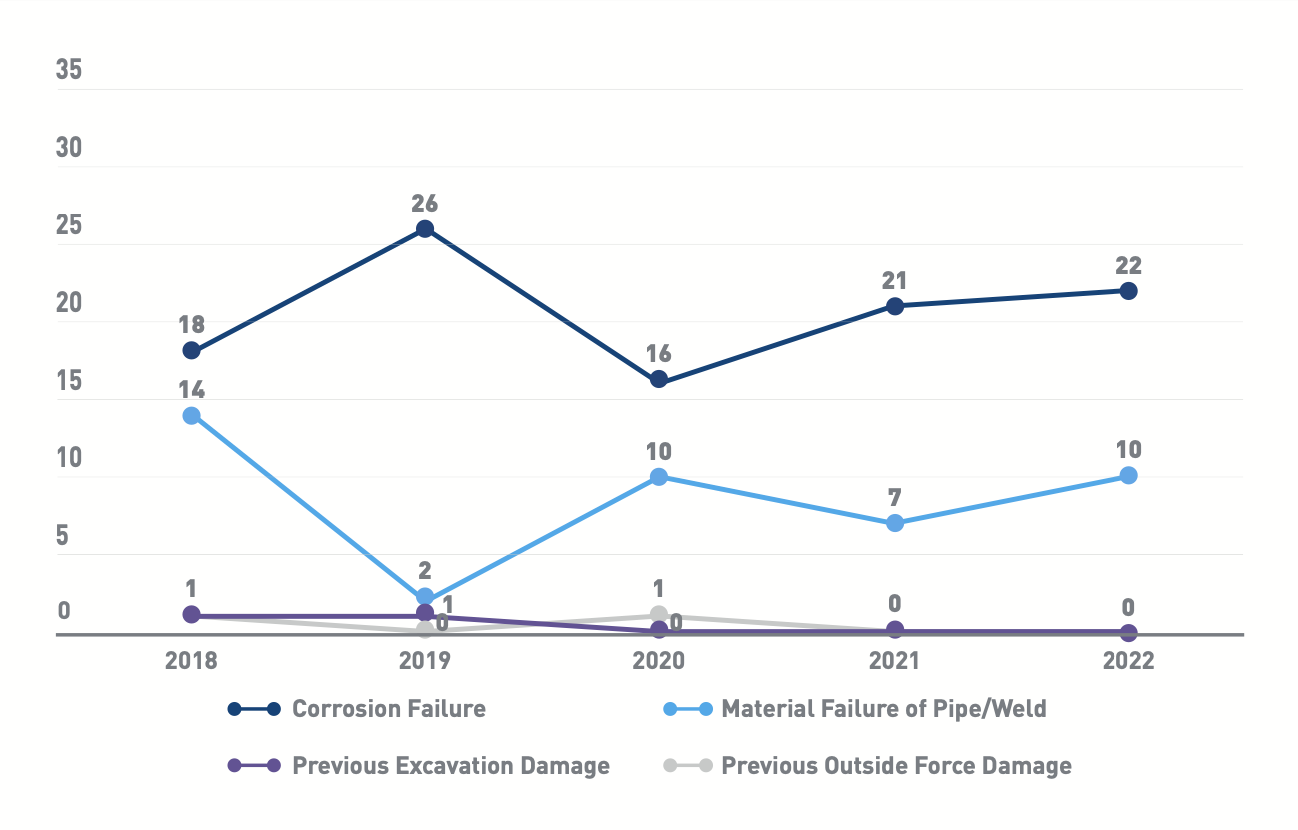
Integrity Management Incidents Impacting People or the Environment
Incidents related to the pipeline itself, such as corrosion, cracking, or weld failure, were down 32 percent over the last 5 years in areas impacting people or the environment. In these areas, corrosion failures are also down 32 percent from 2017 to 2021.
Operations & Maintenance Incidents Impacting People or the Environment
Incidents related to maintaining pipeline equipment or operating the pipeline and its valves or pumps were down 52 percent over the last five years in areas impacting people or the 15 environment. In these areas, incidents caused by incorrect operation decreased by 45 percent, while equipment failure decreased 42 percent from 2018 to 2022.
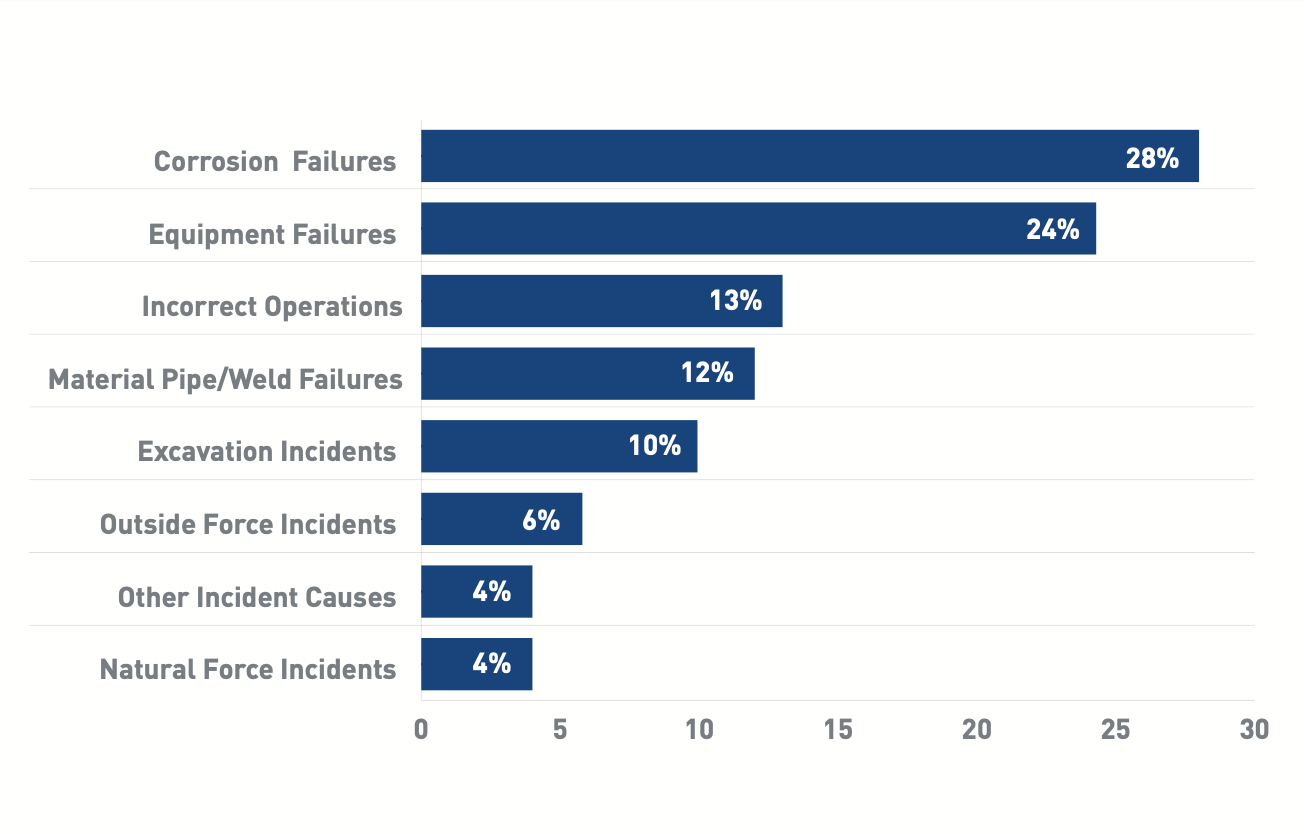
Incidents by Cause
Over the last five years, corrosion failures (28 percent) were the most frequent cause of incidents impacting people or the environment, followed by equipment failure (24 percent), incorrect operation (13 percent) and material pipe/ weld failures (12 percent).
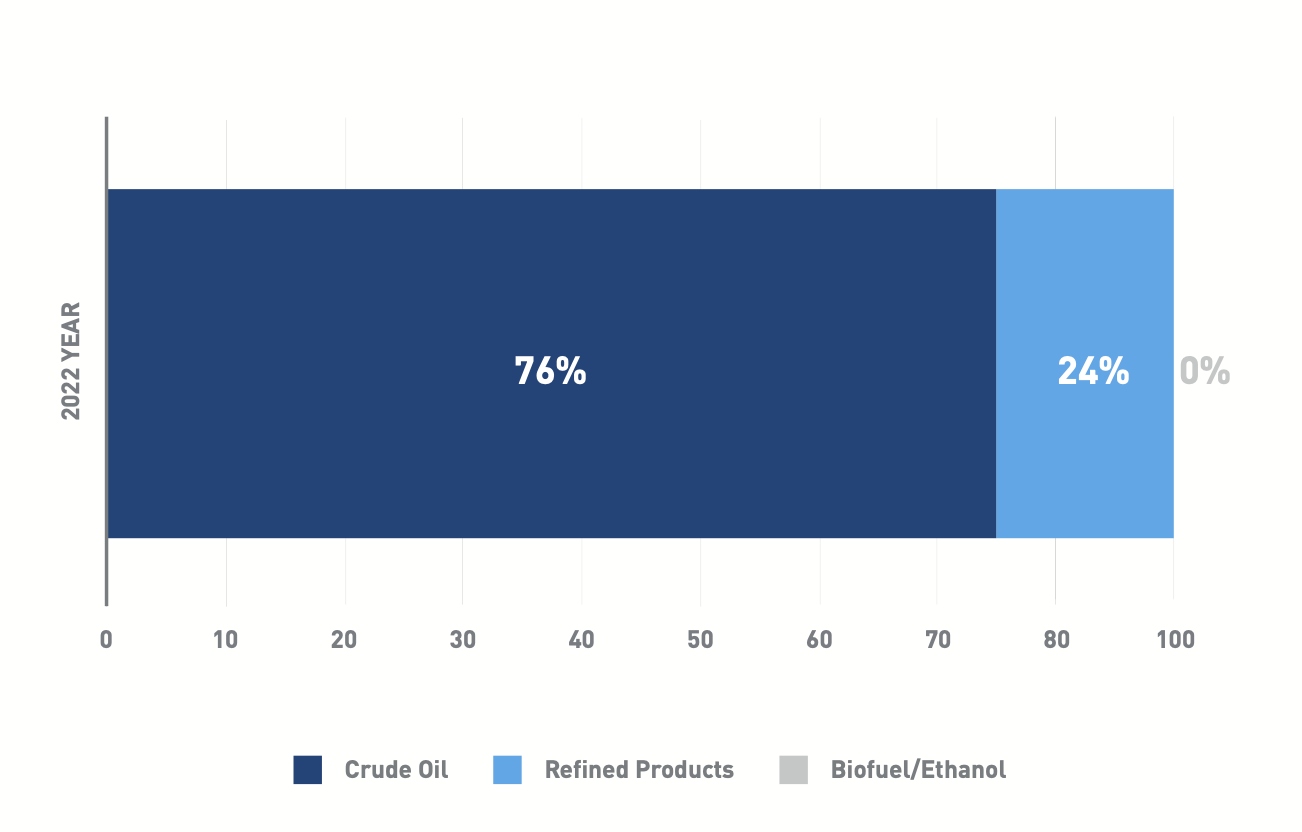
Incidents by Commodity
In 2022, there were 57 crude oil incidents and 18 refined products incidents impacting people or the environment. Refined products incidents impacting people or the environment are down 47 percent over the last five years.
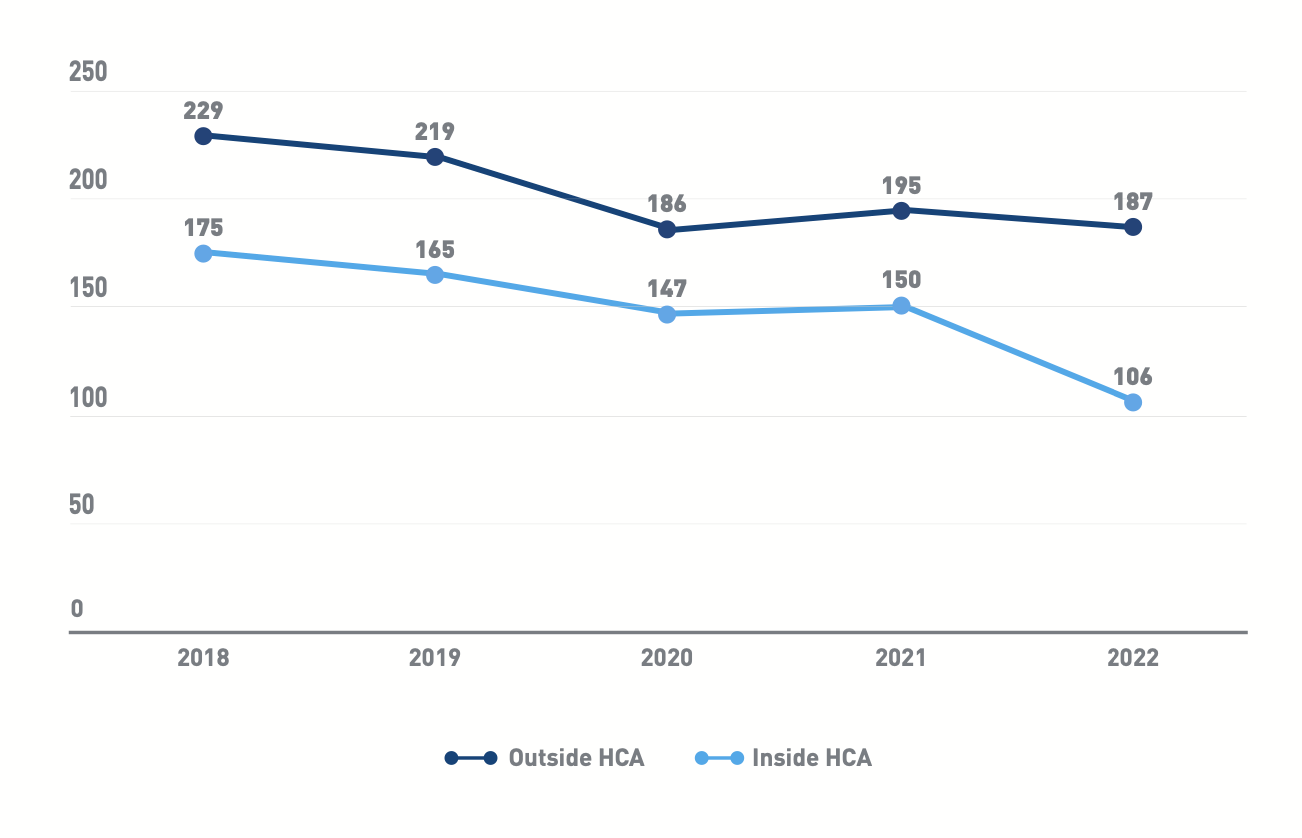
Incidents by Location
Liquids pipeline incidents occurring in high consequence areas (HCAs) declined 39 percent over the last five years. Through federal regulation, PHMSA defines HCAs as areas of population concentration, commercially navigable waterways or sensitive environmental locations. Fewer than half (36 percent) of pipeline incidents occurred in HCAs in 2022. HCA data differs from incidents impacting people or the environment because, under PHMSA regulation, an incident can have no impact on people or the environment, remain wholly within an operator’s facility and still count as an HCA if that facility is surrounded by an HCA.
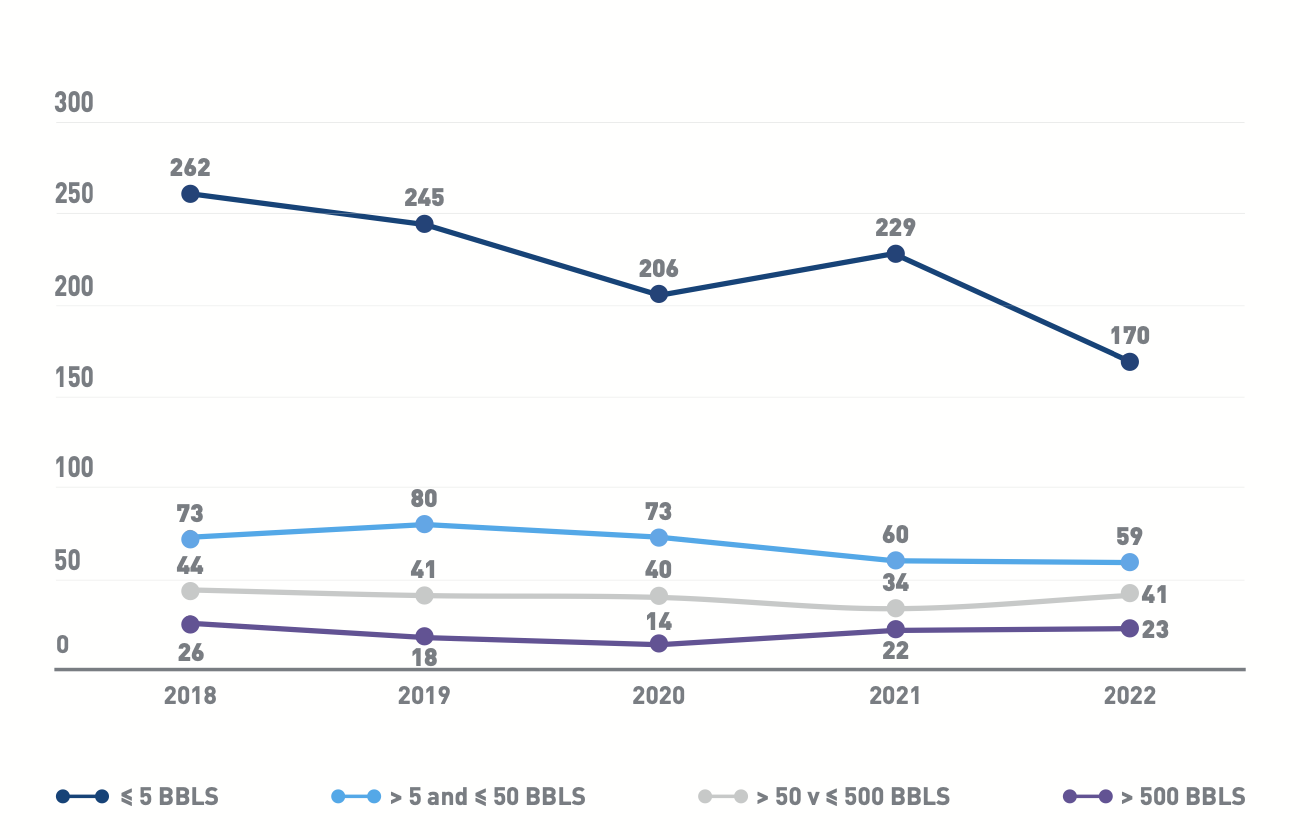
Incidents by Size
Most pipeline incidents are small. In 2022, 58 percent of incidents were less than five barrels and 78 percent were less than 50 barrels. Large pipeline incidents are also the rarest. In 2022, only 8 percent of incidents were 500 barrels or larger, and these large incidents are down 12 percent over the last five years.
Infographic